Monitoring an Application on an EC2 Instance
Creating a simple EC2 process monitor is pretty easy with the AWS Cloudwatch service. This post will give you an idea on how to set up CloudWatch for monitoring your own applications.
On an Ubuntu 16.04 instance, I have an application called stock_app that retrieves portfolio data from an API gateway and stores it in a locally running MySQL database. If the application is running OK, then the mysql, ib_controller, and java processes should always be running. If any of the processes stop running, then Cloudwatch should detect this and I should be notified via email.
This type of monitoring is a classic Heartbeat monitoring scenario. The process status will be sent every few minutes as a Cloudwatch event, so that Cloudwatch can detect if any of the heartbeats fail or are irregular (i.e. one or more processes aren’t running)
Setup the Cloudwatch Rule
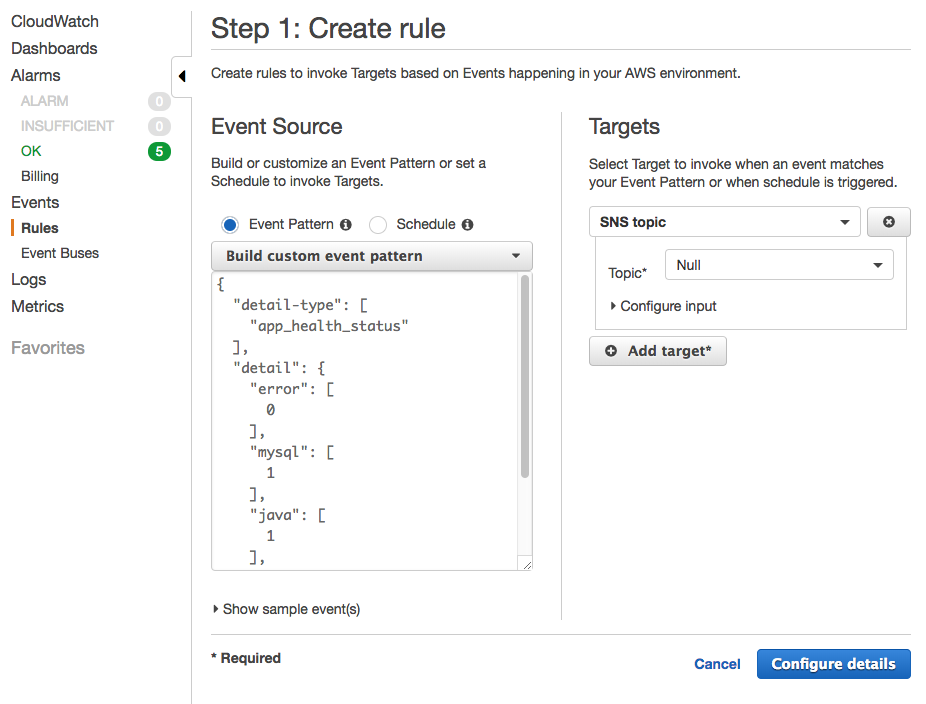
First navigate to Simple Notification Service in AWS and create a SNS topic called NULL, which will just serve as a dummy target for the Cloudwatch event rule.
Next, navigate to Cloudwatch->Rules and add a new rule (e.g. stock_app_health_check). A rule requires an event pattern which will be sent by a heartbeat script running on the EC2 instance. I used the following event pattern to check on the processes I was interested in:
{
  "detail-type": [
    "app_health_status"
  ],
  "detail": {
    "error": [
      0
    ],
    "mysql": [
      1
    ],
    "java": [
      1
    ],
    "ib_controller": [
      1
    ]
  }
}
The above pattern matches if all the processes are running without any errors (1 means that the process is running OK).
On the Target screen on the right, choose the SNS topic NULL.

Setup the Cloudwatch Alarm
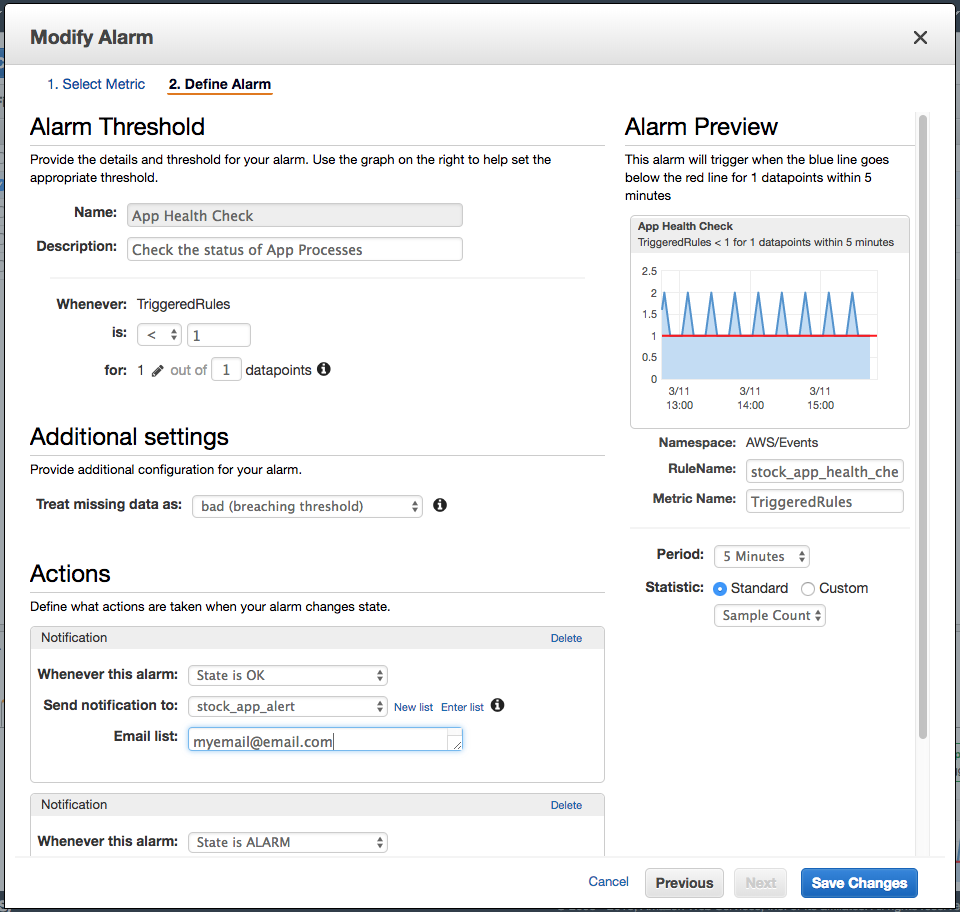
In the Alarms panel, click Create Alarm. Under the Metric, choose By Rule Name and then select the rule created in the prior step.
In the alarm definition, set it so an alarm gets triggered if the rule does NOT get fired in a 5 minute time period. So if one process, like mysql fails, the event received won’t match the pattern, causing the alarm to fire due to the missing rule data.
Here’s what the alarm configuration looks like:

Now you’ll receive errors every time the alarm goes into an error state.
Monitoring Script
The final piece of monitoring the application processes is to create a script called that will send the app process health data as an AWS event. I used a simple Ruby script called app_health.rb to check if the process is running or not. For more complete monitoring, it can be useful to also test if the application is responding or not.
# Default states
java = 1
mysql = 1
ib_controller = 1
error = 0

# Check if the processes are running
java = 0 if (`ps -ax | pgrep java` == "")
mysql = 0 if (`ps -ax | pgrep java` == "")
ib_controller = 0 if (`ps -ax | pgrep IBController.sh` == "")
error = 1 if (java==0 or mysql==0 or ib_controller==0)

# Send the AWS event

cmd = "aws events put-events --entries '[
 {
   \"Source\": \"stockapp\",
   \"DetailType\": \"app_health_status\",
   \"Detail\": \"{
   	\\\"error\\\": #{error},
   	\\\"mysql\\\": #{mysql},
	\\\"java\\\": #{java},
	\\\"ib_controller\\\": #{ib_controller}
	}\"
 }
]'"

`cmd`
Afterwards, setup the cron task to execute the script every few minutes. For example, I have the following line in my crontab that executes the app_health.rb Ruby script every 4 minutes:
*/4 * * * * ruby /home/ubuntu/dev/stock_app/script/app_health.rb
Testing it Out
To test it out, try shutting down one of the 3 monitored processes, you should expect to receive a notification error within 5 minutes. The notification will look something like this:
From: AWS Notifications <no-reply@sns.amazonaws.com>
Subject: ALARM: "App Error" in US West (Oregon)

You are receiving this email because your Amazon CloudWatch
Alarm "App Error" in the US West (Oregon) region has
entered the ALARM state, because "Threshold Crossed: 1
datapoint [1.0 (08/09/17 15:56:00)] was greater than or
equal to the threshold (1.0)." at "Friday 8 September, 2017
16:01:07 UTC".